Hauptseite:en
| German | English | Français | Dutch |
|---|
OpenSeaMap is a worldwide opensource project to create a free nautical chart.
- Website: OpenSeaMap.org
- Chart: map.OpenSeaMap.org
Inhaltsverzeichnis
History
OpenSeaMap was launched in 2009 in response to the great need for freely accessible maritime maps. The aim of OpenSeaMap is to add nautical and tourist information of interest to the mariner to the free world map and to present it in a nautically appealing way. This includes beacons, buoys and other navigation marks, harbour information, repair workshops, ship accessories and much more, but also shopping facilities, restaurants and places of interest. OpenSeamap is a project of OpenStreetMap and uses its database.
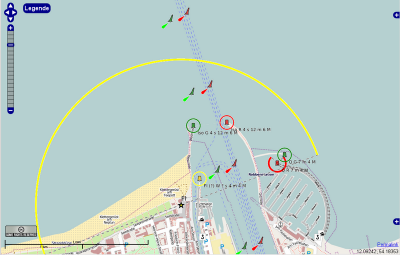
It all started with the model harbour "Warnemünde" and the Kiel Fjord.
Working platform for skippers
Today OpenSeaMap is an integrated working platform for skippers. So much more than just a great electronic sea chart.
The base map corresponds to the OpenStreetMap map. It is supplemented by nautical information, which is also stored in the Openstreetmap database. Further nautical information is displayed with OpenLayers as selectable map layers. Clickable icons contain a lot of additional meta-information, which is displayed in pop-ups on the map, or links lead to further sources of information. Tools help the skipper in his daily work.
OpenSeaMap is open for future developments.
for water sports enthusiasts and sea travellers
OpenSeaMap helps with water sports activities such as kayaking, diving, surfing, fishing and angling during planning and on site.
Seafarers, cruisers, island hoppers and backpackers can find information about ports, islands, tourism, Wikipedia articles, weather, etc.
Layer
In the menu "Display" additional layers can be added to the base map and the sea marks:
Weather
The weather layer shows weather maps: Wind direction and wind force, air pressure, air temperature, precipitation and wave height.
Harbours
The harbour layer shows harbours, marinas and anchorages. A popup shows the harbour name, a link to a meteogram, and for more than 1000 harbours a link to the harbour wiki, where the harbours are described and illustrated with pictures.
Tide gauge
The tide gauge layer shows tide gauges of river gauges and coastal gauges in real time. A pop-up displays detailed data on the water level and links to a water level curve.
Sport
The sport layer shows kayak routes. Colours show the degree of difficulty of sections. Entry and exit points, difficult sections and weirs are marked. Canoe rental stations, training routes, camping sites are also highlighted. River gauges show water levels and discharge rates.
The sports layer also shows diving sites, diving schools, bottle filling stations and swimming pools.
Aerial view
The aerial photo layer shows alternatively to the base map aerial photos in partly high resolution.
Marine profile
The marine profile layer shows bathymetric depth data from 200 to 10'000 m. In low zoom levels a depth profile as stepped and shaded blue scale, in high zoom levels additional depth contours.
Wikipedia
The Wikipedia layer shows 1.7 million georeferenced Wikipedia articles as markers on the map. A popup shows an image from the article and links directly to the article. Alternatively, the articles can also be displayed as an image gallery on the map.
AIS
The AIS layer shows the position of ships with AIS transmitters almost in real time. The ship data are shown in a popup.
Applications
OpenSeaMap can be viewed online on the screen.
For the cruise you can download the current map and take it with you on your notebook, tablet or chart plotter.
Programmes and apps: En:Navigation_program
Translated with www.DeepL.com/Translator (free version)
